Lazy Stats
Your Mac's health at a glance in the menu bar
A menu bar app that shows CPU, GPU, memory, storage, battery and network use at a glance, for Mac users who want a quick, private health check.
Lazy Stats is a Mac app, so it won't run on this device.
Mac App Store
Intel and Apple silicon


Direct download (1.7 MB DMG)
Apple silicon only
This Mac has an Intel chip, so get Lazy Stats from the Mac App Store instead.
Verify download
The DMG is signed and notarized, so macOS checks it when you open it. To compare checksums as well, run this in Terminal and match the result:
shasum -a 256 ~/Downloads/LazyStats-1.3.0-14.dmgSHA-256
3be4fc1175be444f13d7f9cbd33c5d20a79533f3c17577fc0a666ddadbc324ad- Version
- 1.3.0
- Price
- Free
- Requires
- macOS 13 or later
- Lives in
- Menu bar
- Security
- App Sandbox
- Network access
- None
What it does
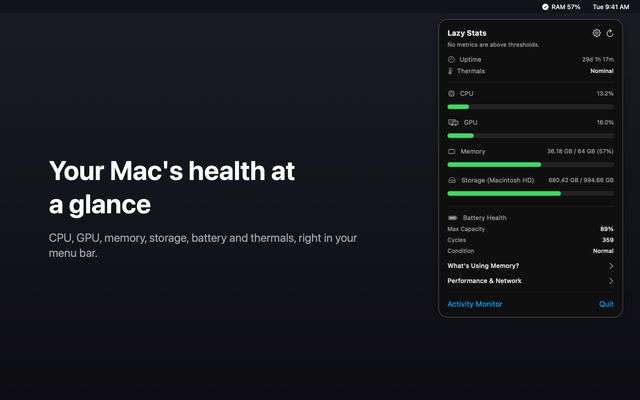
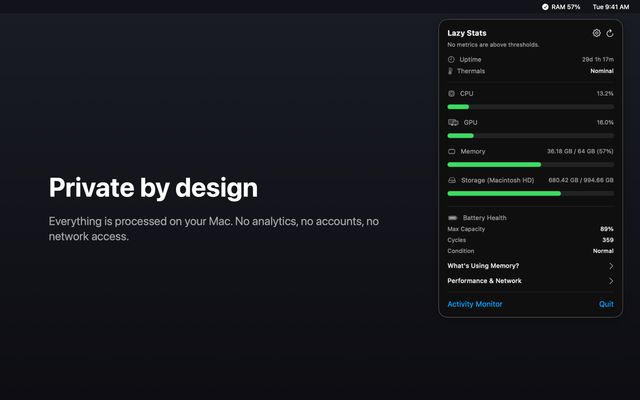
Lazy Stats lives in the menu bar and shows how your Mac is doing: CPU, GPU, memory, storage, battery health, thermals, uptime and network throughput. The icon turns green, yellow or red based on thresholds you set. Detail views break down memory use and show recent trends. Everything is read and processed on your Mac, with no network access, no analytics and no account.
- 01
Menu bar status
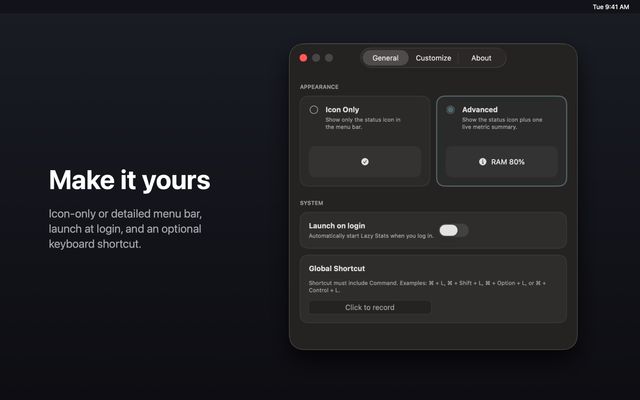
The icon turns green, yellow or red. Advanced mode adds one live metric like RAM 80%; Icon Only shows just the icon.
- 02
Usage at a glance
Bars for CPU, GPU, memory and storage. The top 3 CPU apps appear when CPU passes its high threshold.
- 03
Memory details
Activity Monitor's categories (App Memory, Cached Files, Wired, Compressed, Swap), an estimated pressure level and the top 3 apps.
- 04
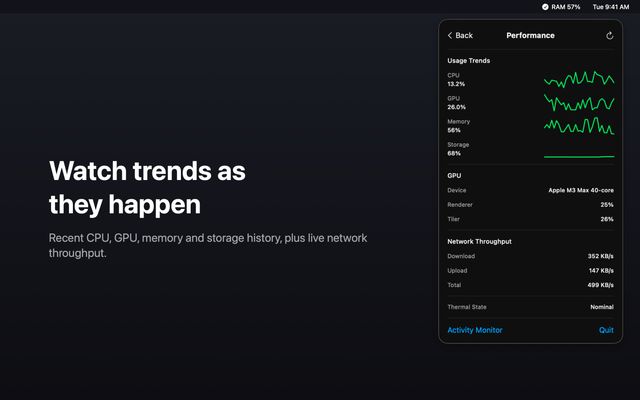
Performance trends
Sparklines of the last 30 samples for CPU, GPU, memory and storage, plus network download and upload rates and the thermal state.
- 05
Battery health
Max capacity and condition from the same source as System Settings, plus cycle count. Rows hide when macOS doesn't report them.
- 06
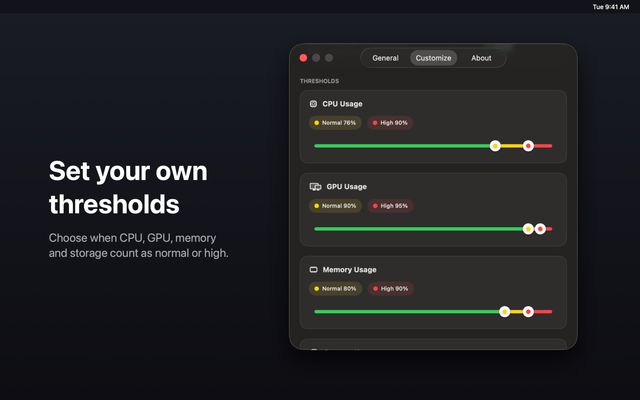
Custom thresholds
Set normal and high levels per metric. Defaults are 80% / 90% for CPU, memory and storage, and 90% / 95% for GPU.
- 07
Global shortcut
An optional ⌘ shortcut opens or closes the panel. New installs start with none, and Settings warns if another app uses it.
- 08
Light when idle
Refreshes every 2 seconds with the panel open and every 10 seconds when closed. Running apps are only scanned while it's open.
A closer look
What's in 1.3.0
- Per-app CPU is now correct on Apple silicon and shown as a share of the whole Mac
- Memory figures now use the same categories and accounting as Activity Monitor
- Helper processes are listed under their app, and other processes show full names
- Battery health and condition now match System Settings; missing values are hidden
- Network throughput no longer wraps on busy interfaces or spikes on new connections
- CPU, network and process rates stay correct across sleep and wake
- New installs get no default shortcut; existing users keep theirs, including ⌘L
- New About tab in Settings with privacy notes, the app version and a website link
- Redesigned threshold sliders with higher-contrast knobs for light and dark mode
- Less background work: no process scanning while the panel is closed